Went viral11:51
How Much CPU Can Handle?
1.7M viewsfrom a 145K subscriber channel
145K-subscriber channel · This video earned ~$15.7Kest.$7.9K to $23.6K
per channel posting 3 videos a month at this niche's typical $194 to $582 per video.
Small CPU Benchmark Comparisons channels are getting videos with 1.7M views and earning real money from YouTube ads.
So far the typical channel here has banked $397 to $1.2K all-time — while the top earner sits at ~$90.2K est. Based on 1.2K videos across 8 channels we analyzed.
Part of Tech & Gadgets

Distribution stats from 1.2K videos and 8 channels analyzed.
Estimated revenue
~$11.5K / mo est.
$5.8K to $17.3K a month est.
about $138.2K per year est.
Estimated ad revenue based on typical CPU Benchmark Comparisons views. Not a guarantee of earnings.
Videos that pulled in far more views than their channels had subscribers.
Went viral11:51 Went viral20:40
 Went viral19:13
 Went viral20:46
 Went viral13:11
 Went viral14:53
You can make original videos in this format with AI today. NoodleTomato writes, voices, and renders a CPU Benchmark Comparisons video for you in minutes.
Browse Tech & Gadgets YouTube niches, compare earnings across the Niche Finder analytics hub, or review the top channels below.
Top CPU Benchmark Comparisons videos usually run about 12 to 20 minutes and earn an estimated $194 to $582 per video, which works out to $582 to $1.7K a month if you post at this niche's typical pace of 3 videos a month. The best ones below pulled in far more views than their channels had subscribers, the clearest sign a brand new channel can still land a hit here.
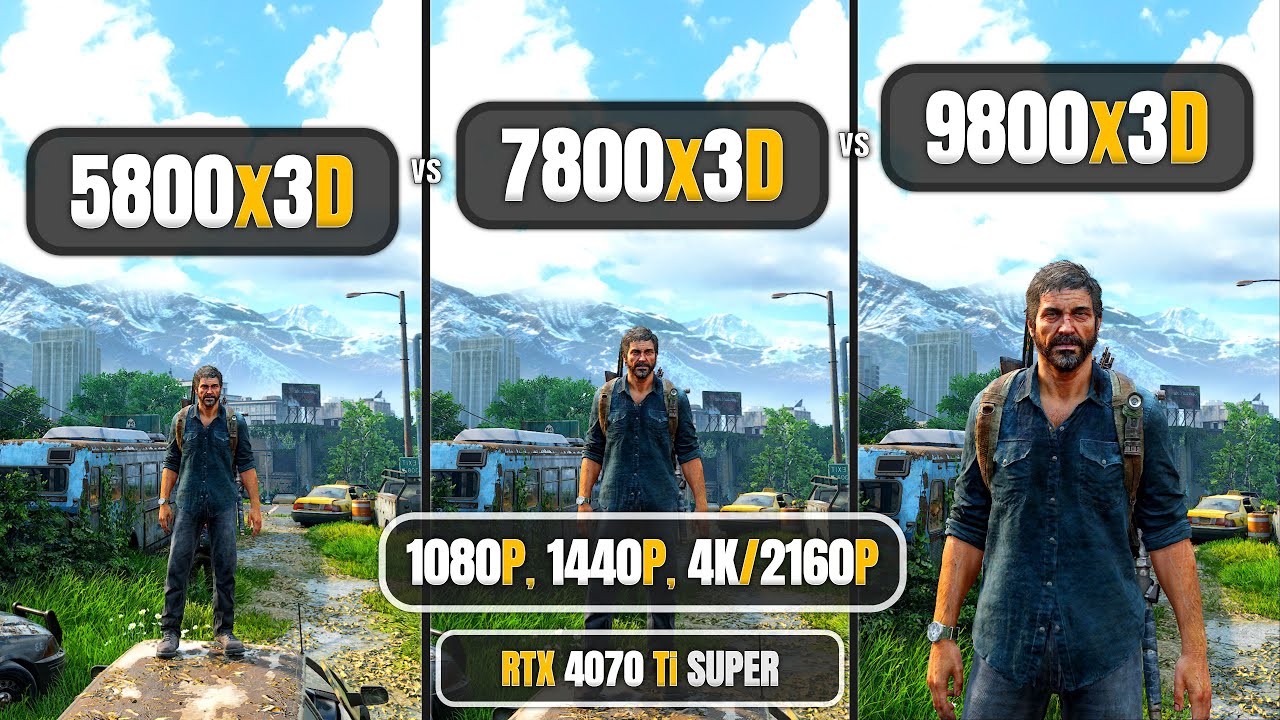
The strongest recent example is “How Much CPU Can Handle?”, which reached 1.7M views from a 145K subscriber channel. Channels in Tech & Gadgets often post about new video every 10 days, so consistency matters as much as one viral upload.
See how CPU Benchmark Comparisons stacks up against nearby opportunities.
Topics with overlapping audience and content patterns.
| Niche | Category | Avg. channel total (est.) |
|---|---|---|
| This niche | Current page | $397 to $1.2K est. |
| GPU Gaming Benchmarks | Gaming | $60 to $239 est. |
| Mini PC Reviews | Tech & Gadgets | $554 to $1.7K est. |
| Gaming PC Build Guides | Tech & Gadgets | $645 to $1.9K est. |
| Gaming Laptop Reviews | Tech & Gadgets | $172 to $516 est. |
| Console Performance Analysis | Gaming | $124 to $495 est. |
| PC Cooling Reviews and DIY | Tech & Gadgets | $638 to $1.9K est. |
| Game Graphics Comparison | Gaming | $607 to $2.4K est. |
| Budget Phone Gaming Tests | Competitive Gaming | $95 to $380 est. |
Related opportunities in neighboring categories.
| Niche | Category | Avg. channel total (est.) |
|---|---|---|
| This niche | Current page | $397 to $1.2K est. |
| GPU Gaming Benchmarks | Gaming | $60 to $239 est. |
| Console Performance Analysis | Gaming | $124 to $495 est. |
| Game Graphics Comparison | Gaming | $607 to $2.4K est. |
| Budget Phone Gaming Tests | Competitive Gaming | $95 to $380 est. |
| Emulator Performance and Setup Guides | Gaming | $68 to $271 est. |
| Low End PC FPS Boost | Gaming | $166 to $666 est. |
| Game Settings Optimization | Gaming | $49 to $197 est. |
Picking CPU Benchmark Comparisons is the easy part. These breakdowns compare what each AI video tool actually automates, and where it stops.
How earnings are estimated, what is public, and when this page was last updated.
Read the full methodology on the Niche Finder methodology page.
Pick this niche and NoodleTomato writes, voices, and edits your first video for you, in minutes.
YouTube shares ad revenue with creators who monetize their channels. Estimated earnings are calculated independently by NoodleTomato from public view data and estimated rate ranges. They are not actual earnings, are not from YouTube, and may not reflect real revenue. Data independently sourced. Not affiliated with or endorsed by YouTube.
How we estimate ·